BOZEMAN – Periods of high-pressure during January resulted in sunny skies and above average temperatures in Montana, causing snowpack percentages to decline in many river basins, according to snow survey data collected by the USDA Natural Resources Conservation Service (NRCS).
This pattern broke down late in the month, and significant snowfall occurred across most of the state of Montana.
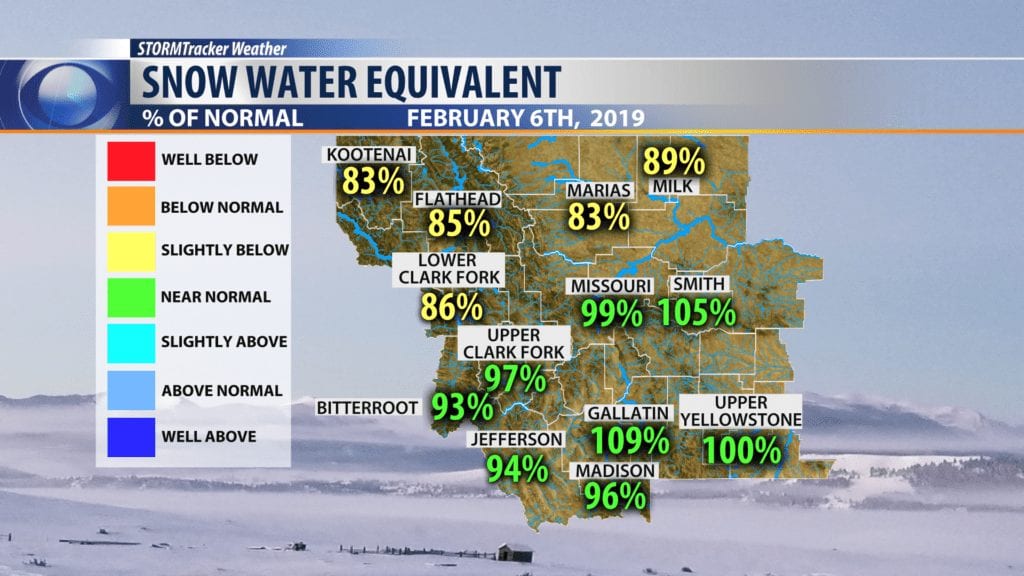
This much needed system of storms added 1.5″ to 3.5″ of Snow Water Equivalent (SWE) to the snowpack, helping some basins in central, south-central and southwest Montana to remain or improve to near to above normal for February 1.
Although the basin-wide snowpack percentages in Gallatin and Upper Yellowstone indicate near to above normal snowpack conditions, there are some areas in southern Montana that have been largely missed by this winter’s storms.
“The late month storms really helped some of the towns in southern Montana where tourism from snowmobiling is critical to the local economies,” said Lucas Zukiewicz, NRCS hydrologist for Montana. “The snowpack in both Cooke City and West Yellowstone was the lowest it’s been in quite a few years in mid-January, and news gets out.”
Fortunately, he said, the storms helped these areas to recover some by February 1, although snowpack remains below normal. Almost all basins east of the Divide have improved snowpack percentages from January 1, but some regions remain below normal for snowpack on February 1.
The western half of the state also benefited from the late January storms, but the river basins experienced decreases in snowpack percentages since January 1 and remain below normal for this date.
“The storms just weren’t enough in the western half of the state to make up for the deficits we’d experienced early in the winter,” Zukiewicz said. “Even with the impressive totals from the late month storms, snowfall ended up being below normal for the month of January.”
River basins in the northwest region of the state typically experience their “wettest” months of the year from early November through the end of January. Below normal snow totals in these areas for this date make recovery to “normal” snowpack conditions before runoff begins less likely.
“For example, the Flathead River basin would need to receive around 135% of normal snowfall between now and when the snowpack reaches peak accumulation, which typically occurs sometime in April,” Zukiewicz said. “While that’s not impossible, it would certainly take a major pattern shift from what we’ve seen so far this winter.”
Similar to last month, mountain temperatures were above average in January and could be one of the impacts the region is experiencing from the weak El Nino that is occurring this year. Whether it strengthens or weakens into the summer of 2019 is still to be determined, but long-range forecasts issued by NOAA continue to indicate above average temperatures for the February – April time-period.
“That’s something we’ll be keeping an eye on,” Zukiewicz said. “Early runoff doesn’t benefit anyone, so hopefully spring is cooler than anticipated.”
Official NRCS streamflow forecasts for April 1 – July 31 will begin on March 1 and will offer a glimpse into what we could expect this spring and summer.
Monthly Water Supply Outlook Reports can be found here after the fifth business day of the month:
Snow Water Equivalent
| 2/1/2019 | % Normal | % Last Year |
| Columbia River Basin | 87 | 72 |
| Kootenai in Montana | 81 | 72 |
| Flathead in Montana | 83 | 72 |
| Upper Clark Fork | 100 | 71 |
| Bitterroot | 87 | 76 |
| Lower Clark Fork | 84 | 74 |
| Missouri River Basin | 95 | 77 |
| Jefferson | 91 | 72 |
| Madison | 85 | 75 |
| Gallatin | 106 | 80 |
| Headwaters Mainstem | 111 | 75 |
| Smith-Judith-Musselshell | 101 | 82 |
| Sun-Teton-Marias | 82 | 71 |
| St. Mary-Milk | 86 | 85 |
| Yellowstone River Basin | 95 | 73 |
| Upper Yellowstone | 98 | 66 |
| Lower Yellowstone | 93 | 82 |
| West of Divide | 87 | 72 |
| East of Divide | 93 | 74 |
| Montana Statewide | 91 | 73 |
Precipitation
| 2/1/2019 | Monthly % Average | Water Year % Average | WY % of Last Year |
| Columbia River Basin | 72 | 88 | 76 |
| Kootenai in Montana | 65 | 77 | 69 |
| Flathead in Montana | 72 | 88 | 72 |
| Upper Clark Fork | 85 | 95 | 80 |
| Bitterroot | 65 | 95 | 89 |
| Lower Clark Fork | 66 | 89 | 79 |
| Missouri River Basin | 97 | 96 | 88 |
| Jefferson | 82 | 91 | 92 |
| Madison | 91 | 86 | 83 |
| Gallatin | 105 | 114 | 95 |
| Headwaters Mainstem | 132 | 103 | 82 |
| Smith-Judith-Musselshell | 115 | 100 | 92 |
| Sun-Teton-Marias | 92 | 90 | 73 |
| St. Mary-Milk | 70 | 87 | 73 |
| Yellowstone River Basin | 92 | 96 | 83 |
| Upper Yellowstone | 92 | 100 | 75 |
| Lower Yellowstone | 89 | 93 | 94 |
| West of Divide | 72 | 88 | 76 |
| East of Divide | 92 | 93 | 83 |
| Montana Statewide | 83 | 92 | 79 |
